


For 10x sales per STORE, think causal, not casual

Listen to the audio version here
Performance KPIs can be quite confusing. Stores on the high street sell more, those in tourist areas do the same. Some have higher traffic conversion, others have higher value per basket. But why is that? And how do you set the right targets for each store? How can we learn from the data to finally grow - big time?
A few months ago I received an urgent call from a client. His name was Peter. He was asked to set the right targets for each of the 50 stores in the country. What sales, what conversion, what value per base, what total traffic should the store manager be chasing?
The rational of benchmarking came to mind - as it probably does in most similar businesses. It says: Look for similar stores and try to match their performance.
While the logic makes intuitive sense, it is fundamentally flawed.
How can it be? Everyone applies it? The answer: you cannot see it with your bare eyes, any more than you can hear a dog whistle. Yet it is real.
“The rationale of benchmarking is fundamentally flawed”
Or in other words: We are used to "casual thinking" and should rather "causal thinking". Let me explain.
Peter was trying to cluster his data, but what he found was not very satisfying. "Maybe I need to ask a segmentation expert," he thought, and contacted me. As we talked, I realized that the only useful clustering exercises I knew came from textbooks. I had been obsessed with marketing science for over 25 years and had never come across a single project.
(Maybe I was looking not hard enough, or maybe I was biased. What I found useful instead was "a posteriori segmentation," which is segmentation based on a known customer characteristic that is predictive of different behaviors or wants and can be identified in the market).
Now Peter and I were sitting around this data sheet. Like most marketing executives, his desire was clear: "Crunch the data and tell me what to do”.
If you have read my 2024 book "Think Causal Not Casual" you know that the quality of insights depends on at least three things: First, we know what the data values mean in real life. Second, we collect data for variables that are missing because they may have an important impact on the outcome and perhaps on the driving variables at the same time. Third, we apply modelling analysis that looks for causal relationships between variables.
Because at the end, business is about driving action to drive results - everything we are looking for is what we call "CAUSALITY". And any data scientist who does not want to deal with this concept is neglecting the core of what businesses want.
Peter gathered a dataset with sales data, traffic data, value per basket, traffic to purchase conversion and a few more. I asked him what experts believe drives these metrics. He came back with the type of location (mall, high street, train or airport), the affluence of the region, and the tourist composition of the traffic.
So we created a separate variable for each property, while for the wealth of the region, he was able to create a buying power index for the zip code.
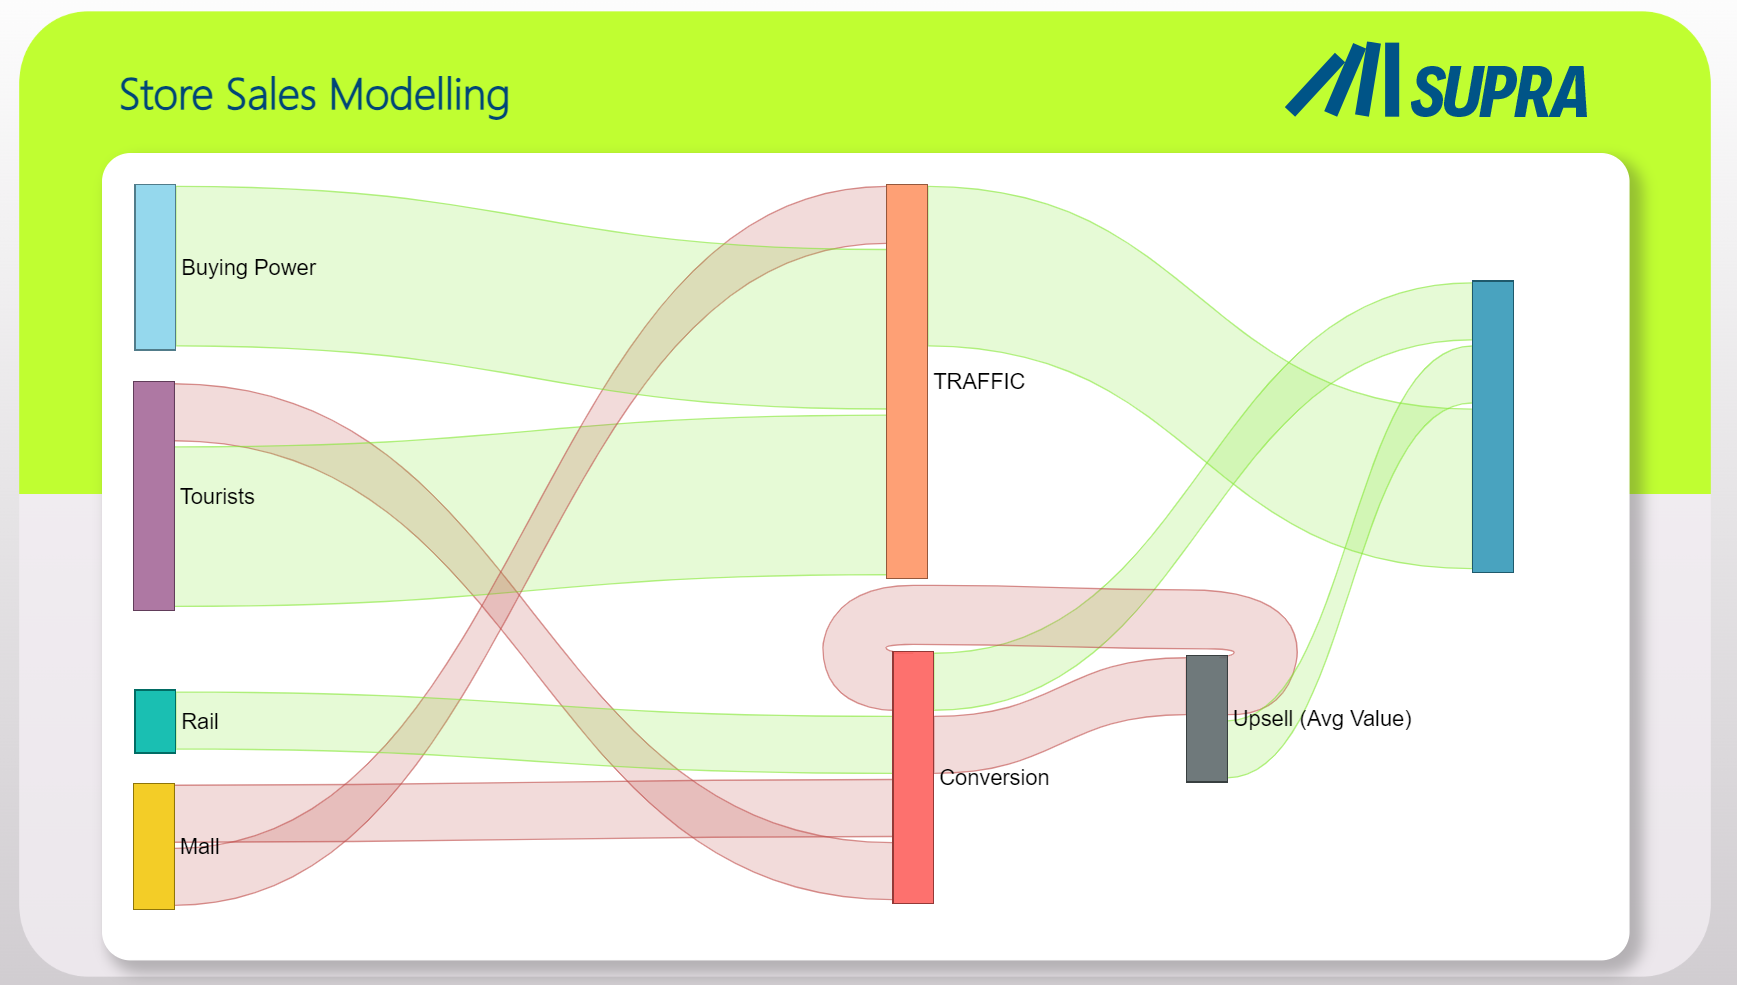
With this small data set, we were still able to run a CAUSAL AI analysis using the SUPRA Causal AI software. The graph shows an overview of the findings.
As with any analysis, you will find some insights that you expected and a view that contradicts conventional thinking.
Insights that challenge conventional thinking:
Although we all think in clusters, there are no clusters. Strong stores are strong because of their high traffic. PERIOD.
The buying strength of the audience (zip code) does not drive traffic conversion and does not drive value per basket.
We would expect tourists to buy less per basket or high street baskets to be larger. Neither location nor traffic (audience) type can explain how much customers buy per basket.
Instead, the key takeaways were
The main revenue driver is traffic. Traffic is driven by tourists, purchasing power and location (lower traffic for mall and rail/airport).
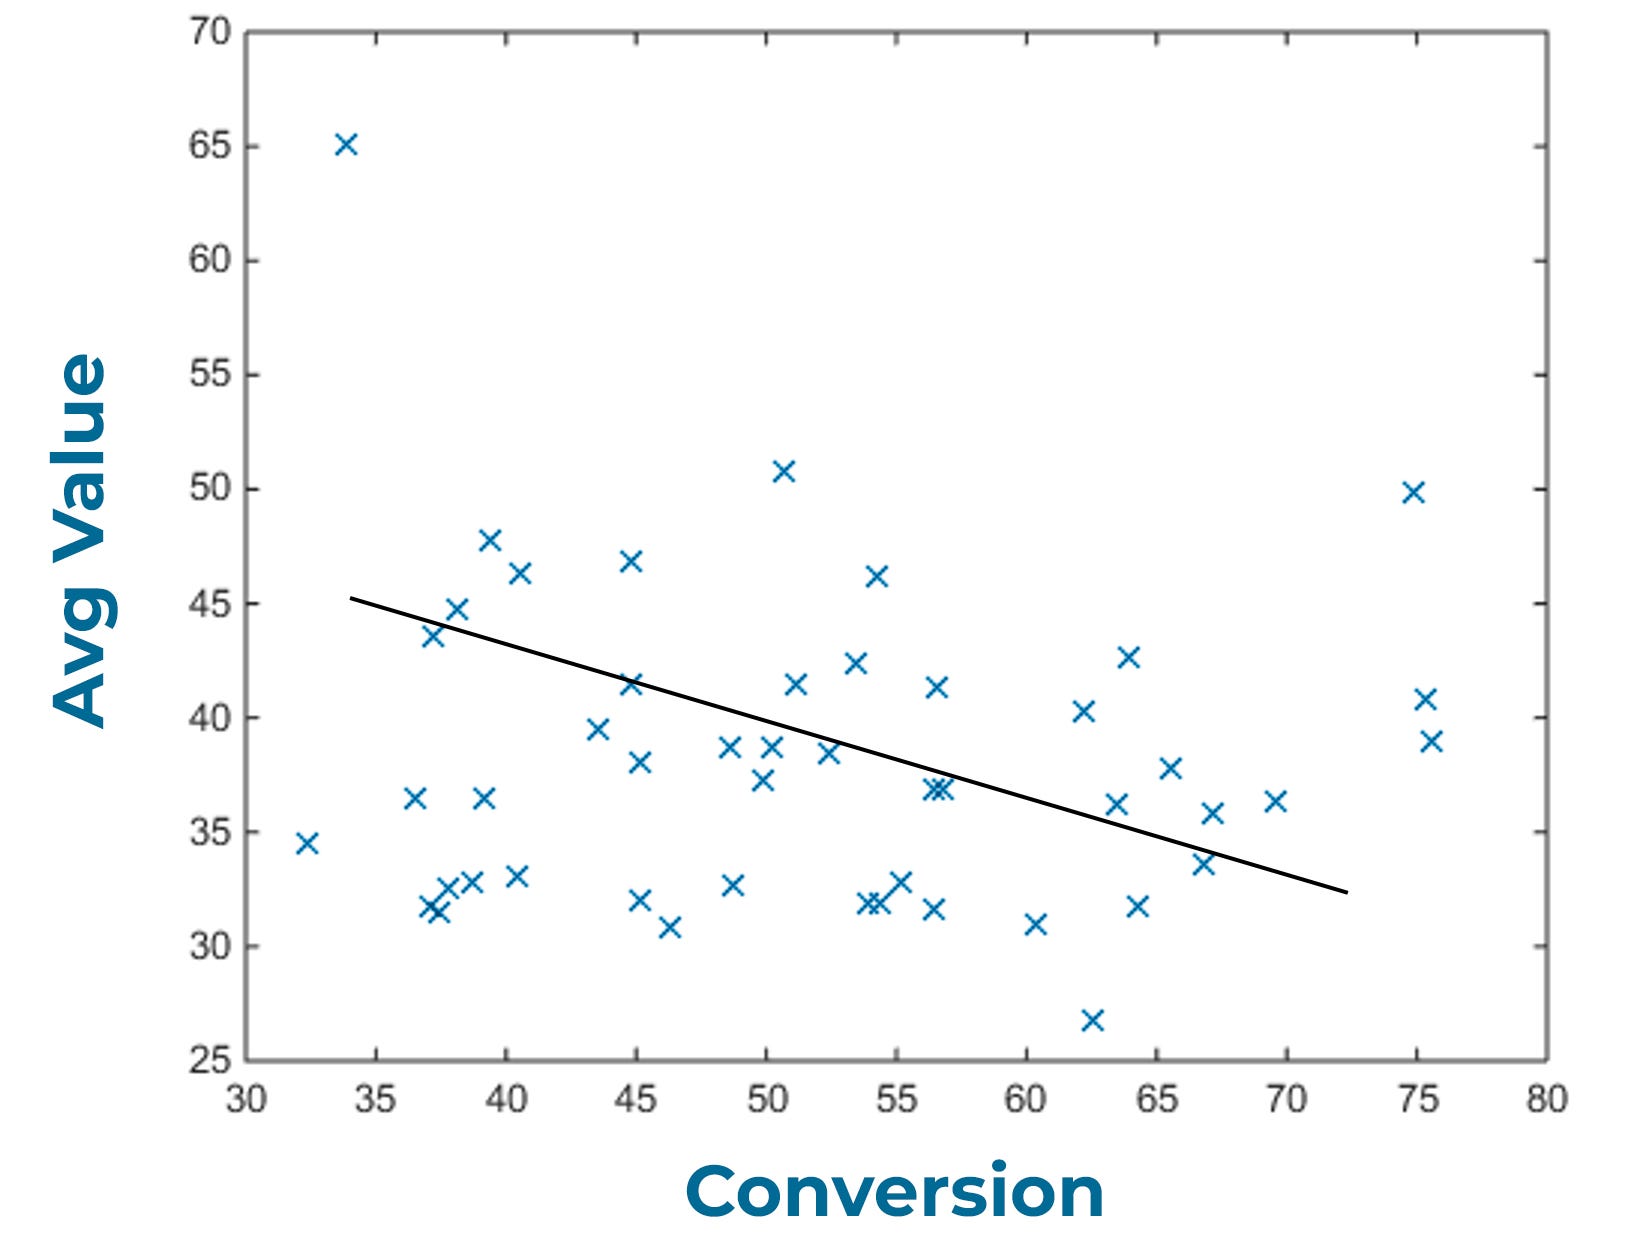
Secondary independent revenue drivers are conversion and value per basket. But increasing one of them by 10% would only result in 2.5% more sales - a paradox? Obviously, they are not independent because they are causally and negatively related. Stores with higher conversion have this because cheap bait products make more customers buy, which lowers the average basket value.
Conversion is lower for tourists and in malls, and higher in train stations and airports.
"Targets on conversion and basket value can fire back if you have not figured out the causal mechanics"
Recommendations
Drive traffic with traffic goals as your number one sales driver. There are many ways to drive traffic, from signage to out-of-home ads. The expected traffic per store can be calculated using the Causal AI model. If the business does not find this transparent enough, it is recommended to simply rely on an individual improvement goal such as "increase traffic by 10%".
Traffic goals should be set per tourist intensity, per purchasing power and per location type.
Do not set conversion goals per store. You can easily cut this metric with limited impact on total sales value. However, you can set a conversion goal per product group and store.
Do not set a value-per-cart goal. It can lead to actions that are not customer-centric and can backfire.
Instead, set a revenue goal. This can be based on Causal AI predictions, or simply a growth target (15% more sales with 10% more traffic).
Do qualitative research to understand what outperformers, e.g. those with high conversion AND high basket value, do differently or what leads to higher basket value. Add data about the expected causes to the data set.
How do you make 10x sales per store?
There is an old saying that there are only three success factors in retail:
First: Location
Second: Location
Third: Location
Sometimes it takes a proper causal analysis to get back to the old wisdom. Retail needs traffic. We learned that zip code affluence, store type, and tourist exposure can be good predictors of expected traffic.
Choosing locations based on traffic expectation can 2x your sales.
Second, Retailers should experiment with all kinds of tools that improve the odds of getting people into the store. This needs to be a priority. Studies show that distinctive signage and advertising can predictably double traffic.
Finally, we learned that (at least Peter's company) does not know enough to understand what really can drive conversion AND basket value. Start with qual, expand with causal quant and I believe the next 2x is doable.
Running an constant insights flywheel consisting of Causal AI and qualitative research…
THIS… is how you 10x your impact